|
Phyre Investigator is a 'workbench' for analysing a range of features
of your protein sequence and a Phyre2 model of your
protein. |
| Please be aware that Phyre Investigator is in Beta-testing. I
am very keen to hear feedback from users regarding problems they have
with the interface, web browser compatibility, strange results, or any
suggestions on how to improve the system. Please contact me (Harry Powell), with any
comments or problems. |
| |
| Your detailed template results will now look something like
this: |
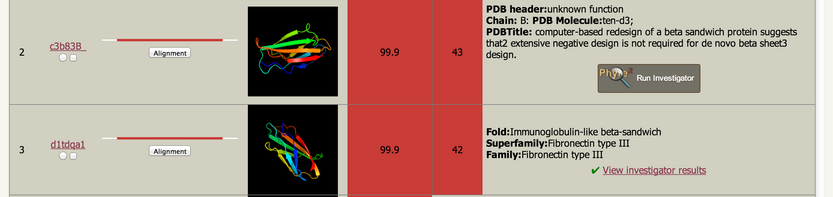 |
| Clicking on the 'Run Investigator' button will let you perform
the analyses on this model of your sequence. The green tick and link
takes you to results of a previously submitted Investigator run. |
| |
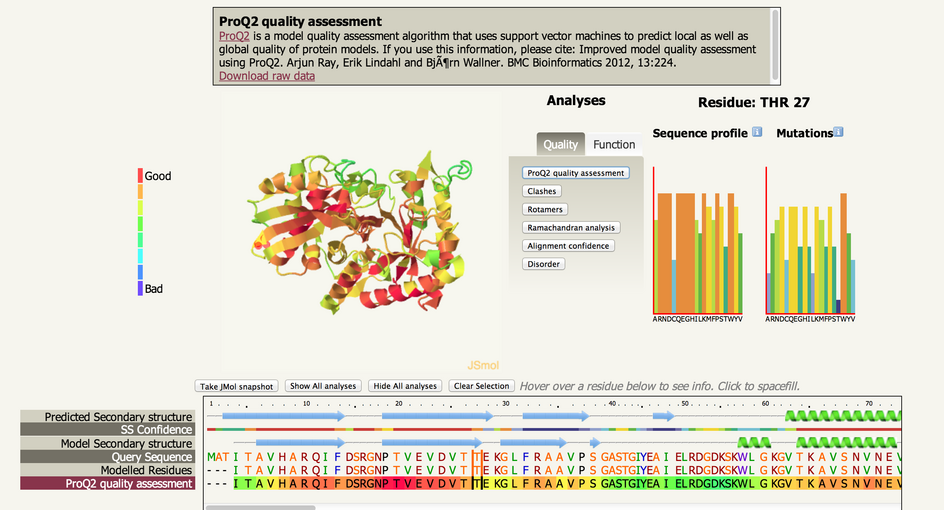
| Below is an example of the interface: |
 |
| |
| Currently, the following analyses are performed: |
- Model quality assessment by ProQ2
- Alignment confidence from HHsearch
- Clashes, Rotamers, Ramachandran analysis by Molprobity
- Disorder prediction by Disopred
- Pocket detection by fpocket2
- Catalytic site detection from the CSA
- Mutational analysis by SuSPect
- Conservation analysis using Jensen-Shannon Divergence
- Interface detection using the protindb and PI-site databases
- Detection of other features using the Conserved Domain
Database
|
Navigating the interface |
| The screen is divided into 3 main sections from top to bottom. The information
box, the structure view and analyses buttons and the sequence view |
| The structure view and analyses section is divided into 3
sections, from left to right: The The JSmol interactive viewer, the Analyses
buttons, and two graphs showing sequence profile and
mutational predictions. |
| |
Analysis buttonsClicking on an analysis button will display, in the information box, a brief summary of whichever
analysis is currently active and links to downloadable raw data. It
will also colour the structure in the JSMol view in accordance with
the analysis chosen and a colour-coded key to the left of the structure. Finally it will add an extra row to the sequence
view, illustrating the same information but in a sequence
context. |
| |
Sequence View |
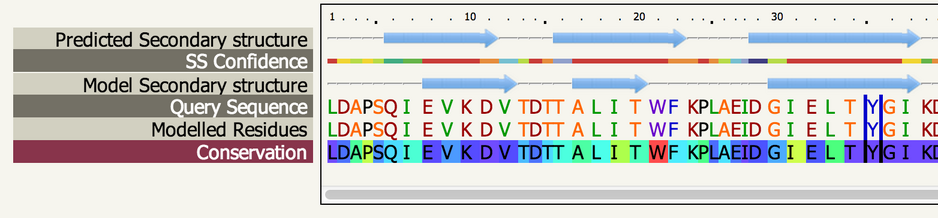 |
| The sequence view displays the predicted secondary structure
of your sequence, the confidence in this prediction, the secondary
structure of the model, your sequence and which regions have been
modelled. In addition, once you've clicked on an analysis button, an
extra row is added showing the corresponding information from the
analysis in a sequence context. |
| Hovering over a sequence position will highlight that position
with vertical bars to either side of the residue in question. It will
also highlight that residue in the JSMol 3D viewer as a red halo
around the atoms of that residue. Finally, it will also show the
appropriate sequence profile and mutation graphs for that
position. |
| Clicking on a residue will cause that residue to be
spacefilled in the JSMol viewer. You may select multiple residue by
repeated clicking. At any time you can clear your selection by
clicking the "Clear selection" button above the sequence view. You may
also take a snapshot of the structure at any time using the "Take JMol
snaphot" button. |
| |
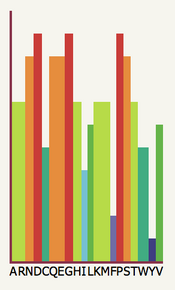
Sequence Profile GraphThe sequence
profile graph represents residue preferences in your protein at a
particular sequence position. These values are calculated by scanning
your sequence against a large sequence database using the iterative
searching program PSI-Blast. |
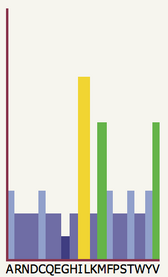 | In the example to the left, the
20 possible amino acid types are labelled along the x-axis with their
one-letter code. The coloured bars indicate the favourability of each
residue type at the currently highlighted position in your
sequence. In this particular position in the sequence, we can see that
I and L are highly favourable (tall and yellow), M and V are
moderately favourable (quite tall and green) whilst the remaining
amino acids are generally unfavourable. In particular G is the most
unfavourable at this position. |
|
Mutational Analysis
GraphThe mutational analysis graph represents the predicted effect of
mutations at a particular position in your sequence. These predictions
are made using the SuSPect method, described below. |
 | In the example to the left, the
20 possible amino acid types are labelled along the x-axis with their
one-letter code. The coloured bars indicate the probability that a
mutation to the corresponding residue will have some effect on
function of the protein or on the phenotype of the organism. In this particular position in the sequence, we can see that
many mutations are likely to effect function, the highest likelihood
coming from mutations to D, G or P. However, Y is very low suggesting
it is the wild-type. However, there are several important caveats. |
|
The SuSPect methodThe SuSPect method is available as
a standalone web server here, where you will
find more information about how the method works and more options for
uploading sets of sequences, viewing pre-calculated results for the
entire human proteome and more. |
| When using SuSPect through Phyre Investigator, it is important
that your sequence is the wild-type. Submitting a mutant protein
to Phyre2 and then Investigator will lead to misleading predictions
from SuSPect. |
Citing SuSPect: SuSPect: Enhanced Prediction of Single Amino Acid Variant (SAV) Phenotype Using Network Features
Yates et al. J Mol Biol. 426(14): 2692-2701 (2014) |
| |
FutureMore help and a video tutorial for Phyre Investigator will be
available in the coming weeks. I hope you find the new system useful
in your research.
Harry Powell |