 |
| |||||
| Protein Homology/analogY Recognition Engine V 2.0 | ||||||
|
|
|
| |||||
| Protein Homology/analogY Recognition Engine V 2.0 | ||||||
|
|
1. What does the code for each solution mean? | ||
What does the code for each solution mean?Each solution in the list has a code something like "c1ut0A_" or "d1lhta_". The initial "c" indicates this protein is a whole chain taken from the PDB, with PDB identifier 1ut0 and chain identifier A. The "_" (underscore character) would tell you which SCOP domain this chain is in, but we gave up using this in 2010! An initial "d" means that this is a domain from a SCOP entry, but otherwise the reading is the same - a four character code for the PDB entry, one character for the chain in the entry and the final character tells you which SCOP domain the entry is derived from. We stopped using SCOP entries when the original SCOP database was no longer being updated (in 2010), so any models starting with a "d" are at least that old. | ||
What software can I use to visualise/analyse/manipulate my protein 3D model?There are a large number of tools available for visualising, manipulating and analysing protein structures and models. The list below is by no means complete. Instead it is my attempt to get you started with some of the tools I've used that I think were pretty good. The best tool for you will be determined by what you want to do. Hopefully you can try the options below and discover which ones do what you need. I am giving the briefest possible outline of each tool as all of them, even the simplest ones, have a large number of features that I don't want to go into here. Also, I am not an expert in any of these tools, so take my descriptions with a large grain of salt! For a more exhaustive list of tools, visit the RCSB Here | ||
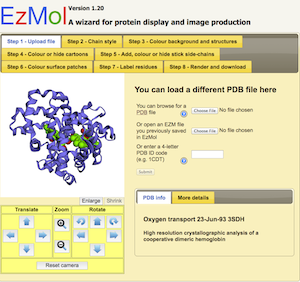
EZmolThis is a web-based wrapper for Jmol/JSmol described below. Pros As the name suggests - ease of use. Gives you a very simple step by step approach to producing a high quality figure. The key point here is there is almost no learning curve. And I'm biased as it was developed in our lab. Cons As this is a browser-based system with JMol at its core, don't expect to do any deep analysis or simulations with it. The compromise of great ease of use is typically some loss of functionality. |
   |
 |
PymolA powerful platform but you may have to pay. Pros Lots of options for rendering, movie making and structure manipulation. Cons I personally find the layout and syntax of commands counterintuitive but your mileage may vary. Also it seems to only be free for 'teachers and students' and you have to register and see if you count as such a thing - otherwise you pay. A big downside to me. Get it at www.pymol.org | |
 |
CCP4 QtMGVery powerful platform that comes with the CCP4 suite. Pros Free - if you have a protein crystallography or Cryo-EM lab it will already be installed. Lots of options for rendering, movie making and structure manipulation. Cons It's a bit difficult to script and isn't as fast as Pymol. Get it at www.ccp4.ac.uk | |
 |
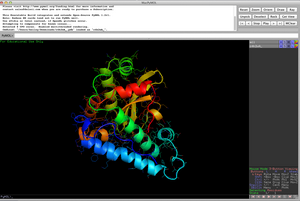
JmolThis is a standalone version of the jmol viewer used in the Phyre2 site. Pros Small and lightweight, good for quickly getting a feel of your structure, under constant development, free and open-source. A good starting point, Jmol was originally based on Rasmol (see below). Cons Don't expect to do any deep analysis or simulations with it. The README that came with it was useless in figuring out what file to run. Based on java, so you may have troubles depending on your system set-up. |
|
 |
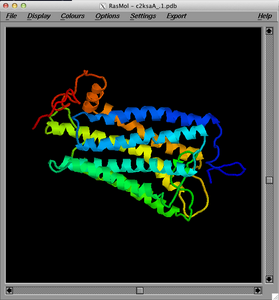
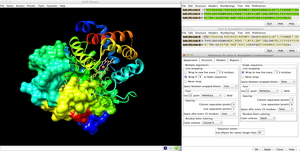
RasmolThis was one of the first and I still use it a lot. Pros Fast and simple to use, free and open source for everyone. Cons Like Jmol above, less functionality than other systems listed here. Getting the right version for recent Mac OS X was a bit of a pain. Pretty old technology. |
|
 |
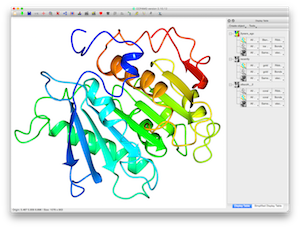
ChimeraA very impressive application from UCSF. Pros A very wide range of functionality, excellent options for fancy images, very well documented and constantly updated. Cons Not many that I can see, except the range of things you can do is so large it may be daunting at first. Available here. | |
 |
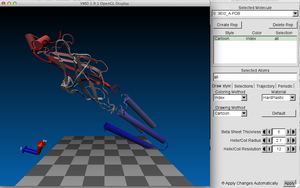
VMDGood for molecular dynamics work, not particular suited to making publication images easily or examining sequence-structure relationships - but I may be wrong! Pros Seems to have a lot of functionality for advanced users, especially for molecular dynamics work, cross platform, free. Cons I find the interface tricky and a bit archaic - for advanced users only I would say. Get it here |
|
 |
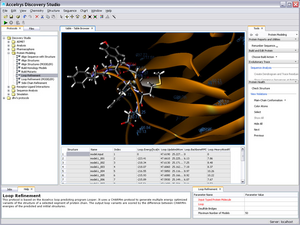
Accelerys Discovery StudioThis has now changed its name to BIOVIA Discovery Studio Visualizer and is distributed by Dassault Systèmes, but it's still free Pros Very impressive, easy to use, nice interface with lots of powerful applications. Free to all academic, government and commercial researchers. Cons Only Windows and Linux (no Mac), need to register for a copy. Get it here. |
|
 |
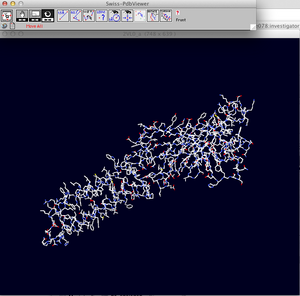
Swiss PdbViewerThis is developed by the SwissModel team and can interact with the Swissmodel server. Pros Lots of functionality and the dynamic interplay between the visualisation and the web server may be very helpful to some. Freely available to all, just a licence agreement to click. Lots of documentation, actively developed. Cons Only available for Mac and Windows (no Linux). I personally find the interface a bit confusing, but as with all these things, there is a learning curve. Get it here. |
|
 |
How can I model the structural effect of point mutations?
Short answer: You can't do it by simply using Phyre to build a model but you can use other resources such as our software Missense3D , Missense3D-DB and PhyreRisk database (see below in the "What you CAN do" section) There is a common misunderstanding that homology modelling will provide an explanation of the structural effects of a point mutation. Unfortunately, the reasons why this is not the case are central to the homology modelling process itself. I will attempt to explain this in further detail below. But see below for what you CAN do, including using our software Missense3D , Missense3D-DB and PhyreRisk database. Why not? The central power of homology modelling is the detection of a homologous structure and the alignment of the user protein sequence to this structure. The actual model building step is simply the direct copying of the backbone coordinates of the known structure and the subsequent relabelling of those amino acids to their aligned counterpart in the user sequence. Thus, the position of the main chain atoms (not the sidechains) will be identical between the template known structure and the equivalent (aligned) residues in the model of the query protein.
The only variation between the model and the template will stem from the modelling of the new sidechain atoms (on a fixed backbone) and in cases when the location of a residue of interest lies within an insertion or deletion relative to the known structure. I will briefly discuss both these cases.
Sidechain modelling: Phyre2, like many or most other modelling tools uses what is regarded as the most reliable method for sidechain modelling. This is based on fitting likely sidechain rotamer conformations onto a fixed backbone. This backbone alters the probability of different rotamers (a backbone-dependent rotamer probability). As such, don't expect to see the backbone differ from the template on which it based.
Loop modelling (insertions and deletions): To handle insertions and deletions (indels), Phyre2 uses a large library of structural fragments. These are searched to find fragments with similar sequence to the user protein that have a geometry that will fit in the gap left by an indel. This works pretty well when the indel is <5 residues, and gets progressively less accurate as the indel length increases. If your point mutation lies within such a region (this can be seen in the detailed alignment view) then it *may* be correct. However, loop modelling is only slightly more accurate than ab initio model building and thus must be treated with extreme caution.
What you CAN do The main purpose of building a model of a protein containing a point mutation is to provide the location of the mutation in a 3D structural context. This in turn can inform you whether the mutation is buried in the hydrophobic core, lying on the surface, near an active site, near an interface, or near a site for post-translational modification. This can guide theories of what effect the mutation may have on function that subsequently need to be tested by experiment.
Fortunately, there are special programs that evaluate the structural impact of an amino acid substitution (also known as a missense variant).
Missense3D
Our group has developed Missense3D which is available as a separate web server at:
http://missense3d.bc.ic.ac.uk/missense3d/
This algorithm will identify if there is a structural impact of your missense variant and provide an explanation. Missense3D was specifically developed and benchmarked to be applicable both to high-quality experimental structures and to Phyre2 predicted structures. Details can be found in our paper:
Ittisoponpisan, S., Islam, S. A., Khanna, T., Alhuzimi, E., David, A. & Sternberg, M. J. (2019). Can predicted protein 3D structures provide reliable insights into whether missense variants are disease associated? Journal of Molecular Biology, 431(11), 2197-2212. Available at: https://doi.org/10.1016/j.jmb.2019.04.009 . Details of similar software can be found in this paper.
PhyreRisk More generally, our PhyreRisk database enables you to map a genetic variant via either its genomic or its protein position directly onto the structure of both 3D experimental coordinates deposited in the Protein Data Bank (PDB) and on precalculated Phyre2 predicted structures.
PhyreRisk is available at http://phyrerisk.bc.ic.ac.uk/
and the paper is: Ofoegbu, T.C., David, A., Kelley, L.A., Mezulis, S., Islam, S.A., Mersmann, S.F., Strömich, L., Vakser, I.A., Houlston, R.S. & Sternberg, M.J., 2019. PhyreRisk: a dynamic web application to bridge genomics, proteomics and 3D structural data to guide interpretation of human genetic variants. Journal of Molecular Biology, 431(13), 2460-2466. Available at: https://doi.org/10.1016/j.jmb.2019.04.043
Phyre Investigator Additional clues can be gained by running your model through Phyre Investigator. This can allow you to investigate model quality features such as Ramachandran and rotamer feasibility. If the mutated residue appears problematic in these terms, it may indicate that the structure in that region is incorrect. This can indicate that the mutation likely causes some structural change there - precisely what change is unclear. Finally you can use the SuSPect facility within Phyre Investigator or its standalone server to determine whether the mutation is likely to have a phenotypic effect.
| ||
Phyre is now FREE for commercial users!
All images and data generated by Phyre2 are free to use in any publication with acknowledgement
Accessibility Statement| Please cite: The Phyre2 web portal for protein modeling, prediction and analysis | |||||||||
| Kelley LA et al. Nature Protocols 10, 845-858 (2015) [paper] [Citation link] | |||||||||
|
| ||||||||