![]()
Results
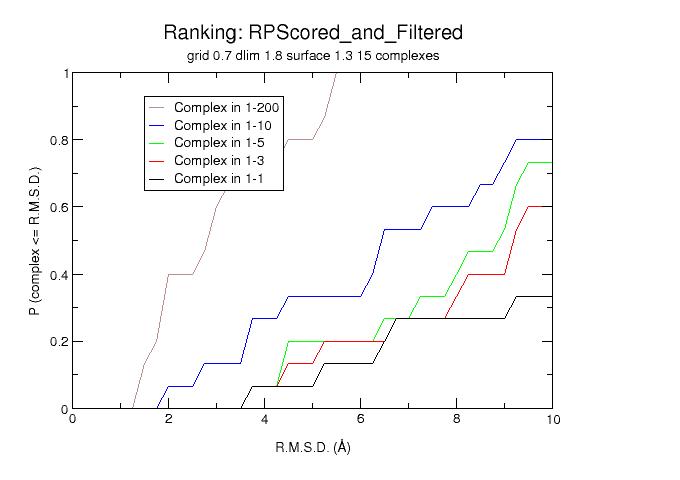
Graphs
Below is a table showing the results attained by using the whole of the 3D-dock suite; i.e. running FTDock, followed by RPScore, a biological filter (where available), and finally MultiDock, for each syatem. MultiDock was only run for systems where there was a post-filter rank < 600, on the top 600 putative dockings.
The results here use a cross-validated matrix for each system, so results from using the non-cross validated matrix provided will not be the same (they improve in most cases).
The results shown here are from 2000, and hence do not include results for some systems which appear in the list of systems.
Ranks for first correct docking where structure is less than 3 Angstroms RMSD over all C-alpha atoms from crystal
| Test | Surface Complementarity | Pair Potential | + Filtering | + MultiDock | |||||
| System | Rank | RMS | Rank | RMS | Rank | RMS | Rank | RMS | RMS of rank 1 |
| 1BRC | 206 | 1.1 | 1 | 2.8 | 1 | 2.8 | 3 | 1.4 | 7.6 |
| 1CGI | 89 | 2.7 | 2 | 2.8 | 1 | 2.8 | 92 | 2.7 | 6.9 |
| 2KAI | 31 | 2.5 | 106 | 1.4 | 21 | 1.3 | 15 | 1.3 | 6.9 |
| 2SIC | 1489 | 2.8 | 82 | 1.6 | 6 | 2.7 | 1 | 1.1 | 1.1 |
| 1BVK | 368 | 1.6 | 272 | 2.2 | 250 | 2.2 | 208 | 3.0 | 10.6 |
| 1MLC | 2375 | 2.6 | 182 | 1.8 | 125 | 1.8 | 326 | 3.0 | 14.1 |
| 1AHW | 240 | 2.4 | 135 | 2.4 | 123 | 2.4 | 1 | 2.4 | 2.4 |
| 1WEJ | 200 | 2.4 | 27 | 2.2 | 27 | 2.2 | 36 | 2.0 | 10.3 |
| 1BGS | 542 | 2.9 | 3 | 2.1 | 3 | 2.1 | 72 | 1.5 | 10.7 |
| 1BDJ | 4901 | 2.6 | 2661 | 2.4 | 2661 | 2.4 | - | - | 13.7 |
| 1DFJ | 3 | 3.0 | 2956 | 2.6 | 941 | 2.6 | - | - | 16.7 |
| 1UGH | 118 | 2.8 | 474 | 2.5 | 60 | 1.8 | 7 | 1.8 | 3.2 |
| 1WQ1 | 769 | 2.7 | 1941 | 2.8 | 1941 | 2.8 | - | - | 13.8 |
| 2PCC | 1328 | 2.3 | 592 | 2.1 | 592 | 2.1 | - | - | 23.2 |
| BLIP | 185 | 1.9 | 106 | 2.2 | 7 | 2.5 | 1 | 1.8 | 1.8 |
Ranks for first correct docking where structure is less than 5 Angstroms RMSD over all C-alpha atoms from crystal
| Test | Surface Complementarity | Pair Potential | + Filtering | + MultiDock | |||||
| System | Rank | RMS | Rank | RMS | Rank | RMS | Rank | RMS | RMS of rank 1 |
| 1BRC | 22 | 3.8 | 1 | 2.8 | 1 | 2.8 | 3 | 1.4 | 7.6 |
| 1CGI | 76 | 3.7 | 1 | 3.6 | 1 | 3.6 | 5 | 4.5 | 6.9 |
| 2KAI | 9 | 3.2 | 1 | 3.5 | 1 | 3.5 | 4 | 3.6 | 6.9 |
| 2SIC | 318 | 4.2 | 82 | 1.6 | 6 | 2.7 | 1 | 1.1 | 1.1 |
| 1BVK | 97 | 4.9 | 25 | 4.4 | 25 | 4.4 | 6 | 4.4 | 10.6 |
| 1MLC | 2373 | 4.7 | 34 | 4.6 | 24 | 4.6 | 203 | 4.8 | 14.1 |
| 1AHW | 23 | 4.1 | 135 | 2.4 | 123 | 2.4 | 1 | 2.4 | 2.4 |
| 1WEJ | 33 | 4.1 | 27 | 2.2 | 27 | 2.2 | 27 | 4.4 | 10.3 |
| 1BGS | 104 | 4.4 | 2 | 4.3 | 2 | 4.3 | 13 | 4.1 | 10.7 |
| 1BDJ | 661 | 4.1 | 687 | 3.9 | 687 | 3.9 | - | - | 13.7 |
| 1DFJ | 3 | 3.0 | 22 | 4.5 | 10 | 4.5 | 6 | 4.9 | 16.7 |
| 1UGH | 61 | 3.5 | 40 | 4.8 | 13 | 4.8 | 1 | 3.2 | 3.2 |
| 1WQ1 | 248 | 4.8 | 198 | 4.0 | 198 | 4.0 | 3 | 4.1 | 13.8 |
| 2PCC | 26 | 4.5 | 59 | 4.9 | 59 | 4.9 | 227 | 5.0 | 23.2 |
| BLIP | 185 | 1.9 | 106 | 2.2 | 6 | 4.5 | 1 | 1.8 | 1.8 |