| Structural Bioinformatics Group |
|
Division of Molecular Biosciences Faculty of Natural Sciences |
|
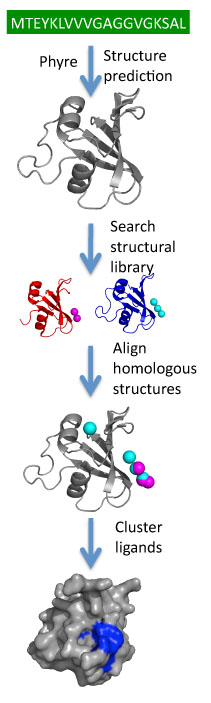
3DLigandSite -Ligand binding site prediction Server
|
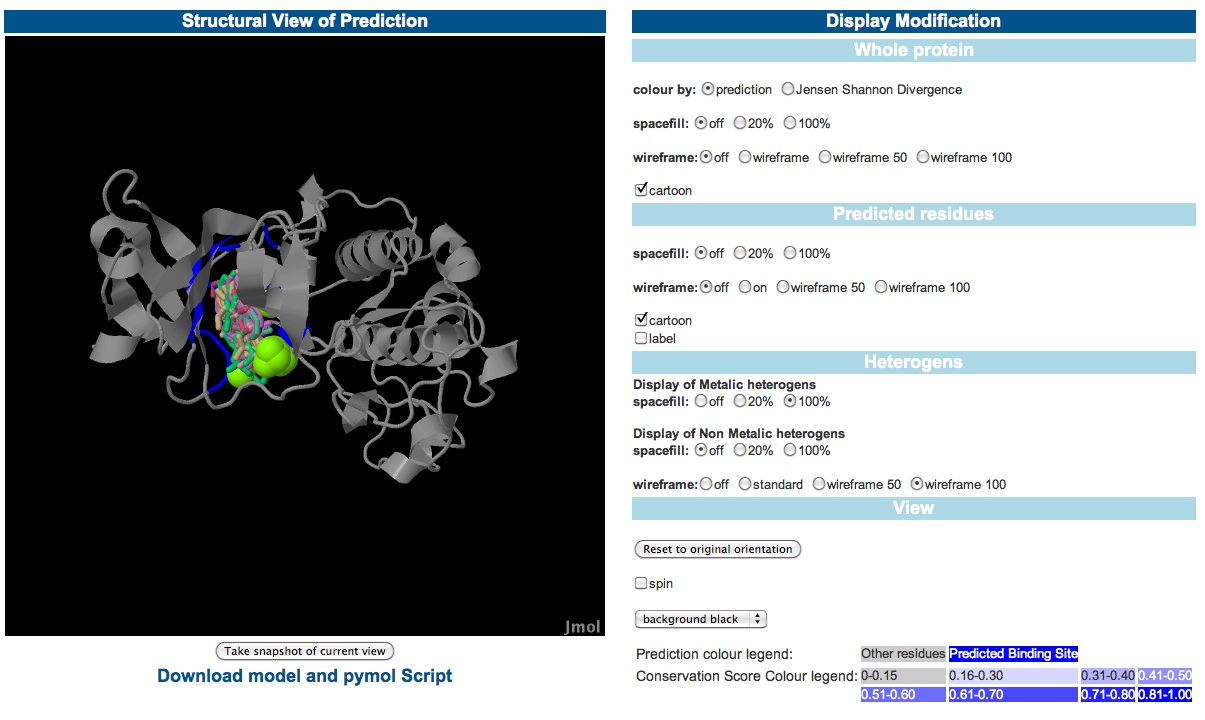
Using Jmol to view the predictionsee description below image - view these results here |
|
The left window is a Jmol applet which displays the modelled structure. The rediues predicted to form part of the binding site are coloured blue. The lilgands that form the cluster used for the prediction are also displayed with metla ions shown in spacefill format and non metal ligands as wireframes. The JAVA runtime environment is required to use the Jmol applet this and is freely avalable from www.java.com if it is not already installed on your system. Documentation on using JMOL can be found at www.jmol.org. Further options are availble to modify the display of the residues predicted to form the binding site and the ligands used to make the prediction. Further the protein can be coloured to show the predicted binding site or the Jensen Shannon divergence score. Predicted residues can also be labelled for easier identification. Finally the user can change the background colour of the Jmol applet and set the protein to rotate. Click to view examples of the way the display can be modified. |
| © Structural Bioinformatics Group, Imperial College, London |
| Mark Wass |