URMSD_reference = sqrt( 2.0 - (2.84 / sqrt(7.0)) )

if (urmsd > URMSD_reference)
    score = 0.0
else
    score = 10.0 * ((URMSD_reference - urmsd) / URMSD_reference)
This process is repeated for all consecutive heptamers thus creating an all-verses-all similarity matrix. Dynamic programming is used to find the optimal path through this local similarity matrix to provide a residue equivalency map. Dynamic programming is
performed with a gap opening penalty of -7.0 and a gap extension penalty of -0.45.
The Root Mean Squared Deviation (RMSD) is calculated as:
              N
rmsd = sqrt( Sum[ di * di ] / N )
              i
// Where:
//   di  = Distance between matched pair i
//   N   = Number of matched pairs
The RMSD is calculated using the superposition between matched pairs that results in the lowest RMSD score. This superposition is computed using the Kabsch rotation matrix[2,3].
The Relative RMSD (RRMSD[4]) is computed using the observed RMSD divided by the average RMSD of two proteins of equivalent radius of gyrations:
rrmsd = rmsd / AverageRMSD(RgA, RgB, pairs)

// Where:
//   RgA   = Radius of Gyration of protein A
//   RgB   = Radius of Gyration of protein B
//   pairs = Number of matched pairs

// To calculate AverageRMSD:

// Calculate the AverageAlignedCorrelationCoefficient, C(N),
// for an RMSD superposition of random proteins over length
// pairs.
Cn = 0.42 +
    ( (0.05 * -(pairs-1)) * exp(-(pairs-1) / 4.7) ) +
    (  0.63 * exp(-(pairs-1) / 37.0) )

// Now calculate the expected rmsd given the C(N)
AverageRMSD = sqrt(RgA*RgA + RgB*RgB - 2.0*Cn*RgA*RgB)
The RRMSD can be assigned a z-score[5] using the standard deviation of RRMSD values observed between random proteins of equivalent size:
z = (rrmsd - 1.0) / StdDevRRMSD(pairs)

// To calculate standard deviation of RRMSD:
StdDevRRMSD =  0.09 +
    1.16 * exp(-(pairs-1) / 1.6) +
    0.25 * exp(-(pairs-1) / 36.0)
The Unit-vector RMSD (URMSD[6]) is calculated using unit-vectors between consecutive Cα atoms. Each vector is aligned at the origin thus creating a set of points on a unit sphere for each structure. These are then aligned to optimise the RMSD between the two sets of points. Since the maximum distance between any two corresponding points is 2 the URMSD has a range between 0 and sqrt(2). In contract to the RMSD, the URMSD is robust to structural deviations far from the core of the model since any point can only contribute a maximum of 2 to the sum total.
The relative URMSD is computed using the observed URMSD divided by the expected UMRSD between an equivalent sized set of random unit-vectors:
rurmsd = urmsd / sqrt(2.0 - 2.84/sqrt(pairs))
The MaxCluster program provides a search algorithm to identify the maximal subset (MaxSub) of paired residues that can be superimposed within a given distance threshold, d. This subset is assessed using the MaxSub score[7] and Template Modelling (TM) score[8].
The search algorithm is a modification of the MaxSub search of Siew et al. (2000). The search begins with an initial seed of contiguous residues. These are then superposed and the structures rotated using their superposition. Pairwise distances are calculated and any residues falling within a set distance threshold are added to the seed. This process is iterated four times using a distance threshold of ¼d, ½d, ¾d and d where d is the distance threshold. The process is then iterated at a distance of d until no more residues can be added to the seed.
The search algorithm uses initial seeds of length 4, ¼N, ½N and N residues where N is the number of residues in the protein. Seeds of length L are chosen at 1 .. L, 1+½L .. L+½L, . . . , N-L .. N. Note that incrementing the start position by half the seed length introduces a dramatic speed gain due to the reduction in the total number of seeds that must be processed. The seed with the largest MaxSub or highest TM-score is used for the final superposition.
The MaxSub score is calculated as:
          1    M
MaxSub = ---  Sum [ 1 / { 1 + (di^2 / d^2) } ]
          N    i
// Where:
//   di  = Distance between identical residues i
//   d   = Distance threshold
//   M   = The number of residues in the MaxSub
//   N   = The number of residues in the experimental structure
The MaxSub score has a range between 0 and 1, where 1 is an identical pair of structures. To avoid insignificant alignment scores, the original MaxSub program set the score to zero if the number of pairs in the MaxSub was below 25 or the number of pairs in the MaxSub was below 40 and the MaxSub score was below 0.125. This feature has been removed in the MaxCluster program. However a command line option exists to allow this functionality (-noscore flag).
The original MaxSub score used a distance threshold of 3.5 Ångstroms. In addition, the score is calculated using only the pairs within the MaxSub although it is normalised by the length of the experiment structure. Consequently (a) the score will be different depending on the order of the proteins on the command line, (b) the score between random proteins is size-dependant and (c) the score will be the same for two different model proteins with identical structure within the MaxSub but different structure outside the MaxSub. These issues were by Zhang and Skolnick (2004) with the Template Modelling (TM) score.
The TM-score for the superposition is calculated as:
            1    N
TM-score = ---  Sum [ 1 / { 1 + (di^2 / d^2) } ]
            L    i
// Where:
//   di  = Distance between identical residues i
//   d   = Distance threshold
//   N   = The number of residue pairs
//   L   = The number of residues in the experimental structure
The TM-score has a range between 0 and 1 and is comparable across proteins of varying lengths due to the use of a size dependant distance threshold. The distance threshold is calculated as:
d = 1.24 x cube_root(N-15) - 1.8
// Where:
//   N   = The number of residue pairs
The expected TM-score value for a random pair of proteins is 0.17. The MaxSub and TM-scores have the advantage over RMSD that short sections of proteins that do not align correctly have less influence on the final score reducing the chance for skewed assessment.
When performing a sequence independant alignment, the initial pairwise mapping between two proteins may not result in the best structural alignment. The mapping may have to be adjusted following initial alignment so that more suitable residues are paired. MaxCluster impliments an iterative optimisation process using the method of TM-align[9]. Using an alignment between two structures, the distance between residues can be used to create a scoring matrix:
if (dij > dmax)
    matrix(i, j) = 0.0;
else
    matrix(i, j) = (1.0 / (1.0 + (dij^2 / d^2)))

// Where:
//   dij  = Distance between residue i (structure A) and residue j (structure B)
//   d    = Distance threshold
//   dmax = The maximum distance allowed for comparable residues

dmax = 1.5 * N^0.3 + 3.5

// Where:
//   N    = The number of residues in the smallest structure
Given the scoring matrix, dynamic programming is used to remap the residues between structures A and B. A Smith-Waterman algorithm is employed with a gap opening penalty of -0.6 and gap extension penalty of 0.
With a new mapping between the two structures, the MaxSub search is repeated to find the optimal superposition. The process of MaxSub search and remapping can be iterated until convergence and the final mapping and alignment score are output. The iterative process can be followed by increasing the logging level of MaxCluster allowing all the mapping stages to be displayed.
The MaxCluster program can assess a structural alignment using the Global Distance Test (GDT) score[10]. This scoring system is provided as part of the LGA package of Zemla (2003) and is the preferred method of structural assessment used in the Critical Assessment of Techniques for Protein Structure Prediction (CASP) experiment. The score is computed as:
GDT score = 100 * (C1 + C2 + C3 + C4) / 4N

// Where:
//   C1   = Count of number of residues superposed below (threshold/4)
//   C2   = Count of number of residues superposed below (threshold/2)
//   C3   = Count of number of residues superposed below (threshold
//   C4   = Count of number of residues superposed below (2*threshold)
//   N    = Total number of residues

// GDT_TS (Total Score)   : threshold = 4
// GDT_HA (High Accuracy) : threshold = 2
The GDT score has a value of 0-100. A random superposition between unrelated structures will have a score of approximately 10-20.
MaxCluster uses the superposition generated using the MaxSub search engine to calculate the GDT score. By default the distance threshold used for the GDT score is 4 Ångstroms (GDT_TS score). However this can be altered on the command line.
The MaxCluster program provides several different methods for selecting representative structures from a set of proteins: Hierarchical clustering, Nearest Neighbour clustering and 3D-Jury. The clustering methods require as input an all-verses-all matrix of comparison scores. This can be generated using the MaxCluster program or can be provided using an alternative comparison program. In this case the program provides the ability to adjust the clustering thresholds to suit the scale of the comparison score.
It should be noted that the MaxSub and TM score have a value of 0-1 where 1 is a perfect match. The clustering routines require the distance metric to specify zero for a perfect match and positive distances thereafter. In order to use the same clustering routines the MaxCluster program subtracts the MaxSub/TM score from 1. This should be remebered when setting the clustering thresholds on the command line where a low initial value of 0.2 means that structures must have a MaxSub of 0.8 to be part of the same cluster.
Hierarchical clustering is performed by MaxCluster using the C clustering library[11].
Clustering begins by joining the two closest data points to create a node. This joining process is repeated, combining the closest items or nodes in pairwise fashion, until all items are members of the same node. A tree structure is then formed by tracing all joining events used to combine items. This tree can be split into n clusters where n is equal to or less than the number of original data points. This is done by ignoring the top n-1 linking events in the tree. The number of clusters, n, is determined using a threshold specifying the maximum allowed distance between two nodes for a joining event. This can be preconfigured or determined dynamically where the threshold is identified at run-time by iteratively incrementing from a starting value until the largest cluster reaches a desired size or a maximum threshold is reached.
Three types of hierarchical clustering are available within the MaxCluster program. They only differ in the method used to calculate distance between nodes:
Note: Cluster centroids can be used to determine the distance between nodes during the clustering process. This is named centroid linkage clustering but confusingly can also be known as average linkage clustering. This is not available within the MaxCluster program.
Clustering results in n clusters, each of which may contain a variable number of structures. Representatives are then selected for each cluster. This is done by calculating the protein with the lowest average distance to all other members of the cluster. This is labelled as the cluster centroid and the average distance defines the spread (or error) of the cluster. Cluster centroids are ranked by their cluster size, and in the case of equal size, by the cluster spread.
Due to their nature, there are speed differences between the different clustering methods. Each method requires comparison of all the pairwise distances between datapoints to determine the distance between nodes. This must be done for all pairwise node combinations for the closest nodes to be identified for the next joining event. However Maximum Linkage clustering only requires that a single distance between node members is greater than the current closest distance for the pair to be eliminated from the search for the next joining event. For this reason ML clustering is faster than SL or AL clustering, although the exact speed gains will be dependant on the data being clustered.
The Nearest Neighbour (NN) clustering algorithm in MaxCluster is based on the method of Shortle et al. (1998)[12].
Nearest Neighbour clustering constructs clusters using the distance between a single data point, the centroid, and all the others. Two proteins are considered part of the same cluster if they are closer than a cut-off threshold, that is they are near-neighbours. For each protein in the dataset, the number of neighbours closer than the cut-off are included in that protein's cluster. Thus in contrast to hierarchical clustering, proteins may be assigned to multiple clusters. The threshold is empirically derived in an iterative procedure identical to the hierarchical clustering search that specifies a minimum initial cluster size. The threshold is then fixed for the remaining procedure. The item with the most neighbours is picked as the cluster centre and the cluster is removed from the pool. This involves removing the centroid and its closest n neighbours. When n is less than the cluster total this is referred to as Restricted Nearest Neighbour (RNN) clustering. The process is repeated until clusters contain less than a minimum number of members.
The previous clustering methods are generic in nature, requiring only a measure of distance between data points to be clustered. 3D-Jury is an alternative clustering method specific to protein model selection[13]. The method uses the MaxSub score to compare protein models. The original method employs a MaxSub search using a distance threshold of 3.5 Ångstroms and structures are considered matched if they share a minimum of 20 pairs of residues at a MaxSub score above 0.2. For each protein in the dataset, matched structures are identified and the number of pairs in their MaxSub is added to the total count for that protein. The actual value of the MaxSub score is discarded. Structures are then ranked using the total count of MaxSub pairs. In this manner the protein that shares the most structure with all the other structures in the dataset will become the top ranked model. It should be noted that there are no clusters of similar models. 3D-Jury therefore provides a method of identifying the most frequent structure found within a model set but not a means of identifying different, frequently occurring structures, for example two different folds within a population.
The original 3D-Jury method employed the MaxSub score for the algorithm. However MaxCluster provides the functionality to use either the TM-score or the MaxSub score for the 3D-Jury method.
[alex@oak] % maxcluster 5znf.pdb pdbs2/model.147.pdb
 _______________________________________________________________________________

                                     MaxCluster

                     Protein structure comparison and clustering

 _______________________________________________________________________________

Iter 1: Prediction size=  30
Iter 1: Experiment size=  30
Iter 1: Pairs=  12, RMSD= 0.531, MAXSUB=0.345. Len=  30. gRMSD= 4.238, TM=0.435

Alignment   ' = mapped, | = maxsub

Prediction  KTYQCQYCEY RSADSSNLKT HIKTKHSKEK
            '''''''''' ''''|||||| ||||||''''
Experiment  KTYQCQYCEY RSADSSNLKT HIKTKHSKEK

 _______________________________________________________________________________
| |||||||||||||||||||||
[alex@oak] % maxcluster 5znf.pdb pdbs2/model.147.pdb -rmsd
RMSD= 3.674 (Pairs=  30, rRMSD=0.512 ( -2.42)), URMSD= 0.718 (rURMSD=0.590)
| ||||||||||||||||||
[alex@oak] % maxcluster -e 5znf.pdb -l model3.list
INFO  : Reading PDB list file 'model2.list'
INFO  : Successfully read 10 / 10 PDBs from list file 'model2.list'
INFO  : Successfully read 10 Chain structures
INFO  : Processing PDB 5znf.pdb vs. List model3.list
INFO  : CPU time = 0.06 seconds
INFO  :  10. 5znf.pdb vs. pdbs2/model.165.pdb   Pairs=  13, RMSD= 0.662, MAXSUB=0.342, TM=0.371, MSI=0.342
INFO  :   9. 5znf.pdb vs. pdbs2/model.128.pdb   Pairs=  12, RMSD= 0.498, MAXSUB=0.352, TM=0.371, MSI=0.352
INFO  :   8. 5znf.pdb vs. pdbs2/model.119.pdb   Pairs=  12, RMSD= 0.520, MAXSUB=0.345, TM=0.374, MSI=0.345
INFO  :   7. 5znf.pdb vs. pdbs2/model.179.pdb   Pairs=  11, RMSD= 0.403, MAXSUB=0.333, TM=0.376, MSI=0.333
INFO  :   6. 5znf.pdb vs. pdbs2/model.118.pdb   Pairs=  11, RMSD= 0.342, MAXSUB=0.342, TM=0.379, MSI=0.342
INFO  :   5. 5znf.pdb vs. pdbs2/model.144.pdb   Pairs=  12, RMSD= 0.456, MAXSUB=0.356, TM=0.390, MSI=0.356
INFO  :   4. 5znf.pdb vs. pdbs2/model.150.pdb   Pairs=  12, RMSD= 0.457, MAXSUB=0.358, TM=0.393, MSI=0.358
INFO  :   3. 5znf.pdb vs. pdbs2/model.191.pdb   Pairs=  12, RMSD= 0.532, MAXSUB=0.343, TM=0.394, MSI=0.343
INFO  :   2. 5znf.pdb vs. pdbs2/model.125.pdb   Pairs=  12, RMSD= 0.318, MAXSUB=0.376, TM=0.397, MSI=0.376
INFO  :   1. 5znf.pdb vs. pdbs2/model.147.pdb   Pairs=  12, RMSD= 0.531, MAXSUB=0.345, TM=0.435, MSI=0.345
| ||||||||||||||||||
[alex@oak] % maxcluster -e 5znf.pdb -l model3.list -rmsd
INFO  : Reading PDB list file 'model3.list'
INFO  : Successfully read 10 / 10 PDBs from list file 'model3.list'
INFO  : Successfully read 10 PDB structures
INFO  : Processing PDB 5znf.pdb vs. List model3.list
INFO  : CPU time = 0.00 seconds
INFO  : 10. 5znf.pdb vs. pdbs2/model.125.pdb   RMSD= 8.286 (Pairs=  30, rRMSD=1.183 (  0.91)), URMSD= 1.070 (rURMSD=0.879)
INFO  :  9. 5znf.pdb vs. pdbs2/model.144.pdb   RMSD= 7.924 (Pairs=  30, rRMSD=1.130 (  0.64)), URMSD= 1.081 (rURMSD=0.888)
INFO  :  8. 5znf.pdb vs. pdbs2/model.118.pdb   RMSD= 7.846 (Pairs=  30, rRMSD=1.126 (  0.63)), URMSD= 1.116 (rURMSD=0.917)
INFO  :  7. 5znf.pdb vs. pdbs2/model.165.pdb   RMSD= 6.666 (Pairs=  30, rRMSD=0.931 ( -0.34)), URMSD= 0.997 (rURMSD=0.819)
INFO  :  6. 5znf.pdb vs. pdbs2/model.150.pdb   RMSD= 5.809 (Pairs=  30, rRMSD=0.840 ( -0.79)), URMSD= 0.918 (rURMSD=0.754)
INFO  :  5. 5znf.pdb vs. pdbs2/model.179.pdb   RMSD= 5.485 (Pairs=  30, rRMSD=0.813 ( -0.93)), URMSD= 0.883 (rURMSD=0.726)
INFO  :  4. 5znf.pdb vs. pdbs2/model.119.pdb   RMSD= 5.114 (Pairs=  30, rRMSD=0.745 ( -1.27)), URMSD= 0.892 (rURMSD=0.733)
INFO  :  3. 5znf.pdb vs. pdbs2/model.191.pdb   RMSD= 4.997 (Pairs=  30, rRMSD=0.742 ( -1.28)), URMSD= 0.841 (rURMSD=0.691)
INFO  :  2. 5znf.pdb vs. pdbs2/model.128.pdb   RMSD= 4.646 (Pairs=  30, rRMSD=0.680 ( -1.58)), URMSD= 0.779 (rURMSD=0.640)
INFO  :  1. 5znf.pdb vs. pdbs2/model.147.pdb   RMSD= 3.674 (Pairs=  30, rRMSD=0.529 ( -2.34)), URMSD= 0.718 (rURMSD=0.590)
| ||||||||||||||||||
[alex@oak] % maxcluster -l model3.list -C 1 -P 10
INFO  : Reading PDB list file 'model3.list'
INFO  : Successfully read 10 / 10 PDBs from list file 'model3.list'
INFO  : Successfully read 10 Chain structures
INFO  : Processed 40 of 45 MAXSUBs
INFO  : CPU time = 0.02 seconds
INFO  : ======================================
INFO  : 3D-Jury (Threshold: >    10 pairs @ > 0.200)
INFO  : ======================================
INFO  : Rank     Model    Pairs       File
INFO  :     1 :        1      151       pdbs2/model.165.pdb
INFO  :     2 :        7      145       pdbs2/model.150.pdb
INFO  :     3 :        6      144       pdbs2/model.144.pdb
INFO  :     4 :        9      142       pdbs2/model.125.pdb
INFO  :     5 :        4      137       pdbs2/model.179.pdb
INFO  :     6 :        8      137       pdbs2/model.191.pdb
INFO  :     7 :       10      137       pdbs2/model.147.pdb
INFO  :     8 :        3      135       pdbs2/model.119.pdb
INFO  :     9 :        5      131       pdbs2/model.118.pdb
INFO  :    10 :        2      129       pdbs2/model.128.pdb
INFO  : ======================================
INFO  : Pairwise single linkage clustering
INFO  : ======================================
INFO  : Hierarchical Tree
INFO  : ======================================
INFO  : Node     Item 1   Item 2      Distance
INFO  :     0 :        6        1        0.476  pdbs2/model.144.pdb  pdbs2/model.165.pdb
INFO  :    -1 :        7        4        0.484  pdbs2/model.150.pdb  pdbs2/model.179.pdb
INFO  :    -2 :        9        2        0.576  pdbs2/model.125.pdb  pdbs2/model.128.pdb
INFO  :    -3 :       -2        0        0.598
INFO  :    -4 :       10       -3        0.615  pdbs2/model.147.pdb
INFO  :    -5 :       -1       -4        0.618
INFO  :    -6 :        8       -5        0.620  pdbs2/model.191.pdb
INFO  :    -7 :        3       -6        0.626  pdbs2/model.119.pdb
INFO  :    -8 :        5       -7        0.629  pdbs2/model.118.pdb
INFO  : ======================================
INFO  : 1 Clusters @ Threshold  0.800 (0.8)
INFO  : ======================================
INFO  : Item     Cluster
INFO  :     1 :        1                        pdbs2/model.165.pdb
INFO  :     2 :        1                        pdbs2/model.128.pdb
INFO  :     3 :        1                        pdbs2/model.119.pdb
INFO  :     4 :        1                        pdbs2/model.179.pdb
INFO  :     5 :        1                        pdbs2/model.118.pdb
INFO  :     6 :        1                        pdbs2/model.144.pdb
INFO  :     7 :        1                        pdbs2/model.150.pdb
INFO  :     8 :        1                        pdbs2/model.191.pdb
INFO  :     9 :        1                        pdbs2/model.125.pdb
INFO  :    10 :        1                        pdbs2/model.147.pdb
INFO  : ======================================
INFO  : Centroids
INFO  : ======================================
INFO  : Cluster  Centroid  Size        Spread
INFO  :     1 :        1       10        0.566  pdbs2/model.165.pdb
INFO  : ======================================
| |||||||||||||||||||||||||||||||||||||||||||||||||||||||||||||||
[alex@oak] % maxcluster -l model3.list -C 4 -is 3 -rmsd
INFO  : Reading PDB list file 'model3.list'
INFO  : Successfully read 10 / 10 PDBs from list file 'model3.list'
INFO  : Successfully read 10 PDB structures
INFO  : All vs. All RMSD
INFO  : Processed 40 of 45 RMSDs
INFO  : CPU time = 0.00 seconds
INFO  : ======================================
INFO  : Nearest Neighbour clustering
INFO  : ======================================
INFO  : Centroids
INFO  : ======================================
INFO  : Cluster  Centroid  Size        Spread
INFO  :     1 :        1        3        2.203  pdbs2/model.165.pdb
INFO  : ======================================
INFO  : 1 Clusters @ Threshold  4.000 (Assigned 3 / 10)
INFO  : ======================================
INFO  : Item     Cluster
INFO  :     2 :        0                        pdbs2/model.128.pdb
INFO  :     4 :        0                        pdbs2/model.179.pdb
INFO  :     5 :        0                        pdbs2/model.118.pdb
INFO  :     6 :        0                        pdbs2/model.144.pdb
INFO  :     8 :        0                        pdbs2/model.191.pdb
INFO  :     9 :        0                        pdbs2/model.125.pdb
INFO  :    10 :        0                        pdbs2/model.147.pdb
INFO  :     1 :        1                        pdbs2/model.165.pdb
INFO  :     3 :        1                        pdbs2/model.119.pdb
INFO  :     7 :        1                        pdbs2/model.150.pdb
INFO  : ======================================
| |||||||||||||||||||||||||||
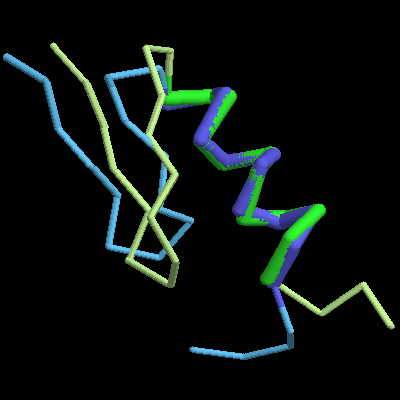
The following images were produced using the superposition output of MaxCluster. The output is a script suitable for viewing in rasmol[14]. Although Cα traces are shown, the output script contains all the original input coordinates.
[alex@oak] % rasmol -script align.rsm
Superposition of the zinc-finger protein 5znf with a model produced using a de novo modelling protocol. The image shows the experiment in blue and the prediction in green. Residues in the MaxSub are shown as thick tubes in a darker shade.
[alex@oak] % rasmol -script super.rsm
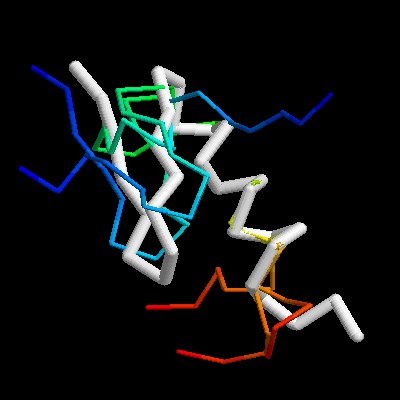
Superposition of the zinc-finger protein 5znf with 3 models produced using a de novo modelling protocol. The image shows the experiment in white using thick tubes. The predictions are shown with thin tubes using a rainbow color scheme from N-terminus (blue) to C-terminus (red).
% maxcluster -e experiment.pdb -p prediction.pdb

// Quick command line - the experiment PDB is assumed to be second on the command line
% maxcluster prediction.pdb experiment.pdb

// Quick command line with distance threshold of 3.5
% maxcluster prediction.pdb experiment.pdb 3.5
List processing:
% maxcluster -e pdb1 -l listAll-verses-all comparisons:
% maxcluster -l listIn the following options n refers to an unsigned integer and f refers to a floating-point number. Argument values in brackets [] are compulsory, argument values in parentheses {} are optional.
|
| ||||||||||||||||||||||||||||||||||||||||||||||||||||||||||
| ||||||||||||||||||||||||||||||||||||||
Contact maps are used to specify the residues in a protein structure that are touching. Given a pair of structures for the same sequence, the contact maps can be compared for similarity. Contacts are identified if the Cβ (Cα for Glycine) atoms of two residues are within a set distance. Residue contacts closer than a set sequence separation are ignored.
MaxCluster has the ability to compare the contact map of a reference structure against a single or a list of model structures using the -contact option in RMSD mode. The output shows the percentage of native contacts found in the model (i.e. the number of contacts in the model that are also found in the native):
[alex@oak] % maxcluster -e 5znf.pdb -p pdbs2/model.119.pdb -rmsd -contact
RMSD= 5.114 (Pairs=  30, rRMSD=0.721 ( -1.38)), URMSD= 0.892 (rURMSD=0.733), NC= 62.50% (5/8)
Options:
|
MaxSubDom (MaxSub Domain) is an iterated version of MaxSub. It was invented by Daniel Fischer (coinventor of MaxSub, Siew et al. (2000)) as a measure to assess multiple-domain structures.
When modelling multiple domain proteins, it is often possible to predict both domains to high accuracy but the orientation of the domains may be incorrect. Thus an algorithm that aligns the entire protein will superpose neither domain correctly and an algorithm that align subsets (e.g. MaxSub) will superpose one domain and the other will be totally misaligned. This problem can be circumnavigated by running MaxSub, extracting the set of atoms in the subset and running MaxSub again on teh remaining atoms.
MaxCluster provides the ability to iterate MaxSub searches in a MaxSubDom mode. Following each iteration the atoms in the MaxSub are removed from the structures and the search repeated. This continues for a set number of iterations or until the MaxSub fails certain criteria. The result is scored using the cumulative total of the MaxSub scores for each iteration. Alternatively the result can be scored using MaxCluster's own MaxSub Iterations (MSI) score:
MSI = 0
for 1 .. N
    MSI += MaxSub / i

// where
//   MaxSub  = MaxSub score of iteration i
//   N       = Total number of iterations
The MSI score is equivalent to the area under the cumulative total of the successive MaxSubs. This favours models where a larger MaxSub score is achieved in early iterations. The following diagram illustrates the difference between the two scores:
             Iteration               MSI                   MaxSubDom
                                    0.475                    0.55
             1     2
            0.4   0.15         (0.4   +  0.55) / 2         0.4 + 0.15
     1-|
       |
       |                                ------               ------
MaxSub |    ___                ______   |    |               |    |
 Score |                       |    |   |    |               |    |
       |                       |    |   |    |               |    |
       |          ---          |    |   |    |               |    |
     0-|                       |    |   |    |               |    |


             Iteration               MSI                   MaxSubDom
                                    0.425                    0.55
             1     2
            0.3   0.25         (0.3   +  0.55) / 2         0.3 + 0.25
     1-|
       |
       |                                ------               ------
MaxSub |                                |    |               |    |
 Score |    ___                ______   |    |               |    |
       |          ---          |    |   |    |               |    |
       |                       |    |   |    |               |    |
     0-|                       |    |   |    |               |    |
Both cases receive the same total using the MaxSubDom score. However the case with the higher MaxSub score for the first alignment scores higher using the MSI score. It should be noted that:
When comparing two structures, the MaxCluster program provides the ability to output the coordinates of the model superposed on the reference structure for each of the iteration MaxSubs.
Options:
|
MaxCluster provides the facility to write/read the all-verses-all distance matrix to/from file. This allows repeated clustering analysis to be done on the same data. The file format used by the program is very simple fixed-width format. It consists of:
The size and chain records are the same for RMSD or MaxSub results files. The results records are different for the RMSD, MaxSub or MaxSub lite output files. Comments are allowed in the files by starting the line with a # character.
Results files are written using the -R option. Because the results files are different for MaxSub or RMSD analysis there are two loading options. MaxSub results file must be loaded with the -M option and distance matrix files (RMSD/URMSD) must be loaded with the -F option.
The records are explained below.
SIZE : <N>

Where:
N    = The size of the distance matrix

e.g.
SIZE : 10
PDB  : <ID> <Filename>

Where:

ID       = The ID of the PDB file
Filename = The name of the PDB file

e.g.
PDB  :      1   pdbs2/model.165.pdb
DIST : <ID> <ID> <Distance>

Where:

ID       = The ID of point 1 (must be between 1 and Size)
ID       = The ID of point 2 (must be between 1 and Size)
Distance = The distance between point 1 and 2 (must be zero or above)

e.g.
DIST : 1 2 2.3
TRANS: <ID> <ID> <MaxSub> <Pairs> <CoM1 x y z> <CoM2 x y z> <rotmat ...>

Where:

ID           = The ID of molecule 1 (must be between 1 and Size)
ID           = The ID of molecule 2 (must be between 1 and Size)
MaxSub       = The MaxSub score between molecule 1 and 2 (must be 0 - 1)
MaxSub       = The MaxSub score between molecule 2 and 1 (must be 0 - 1)
Pairs        = The MaxSub pairs between molecule 1 and 2 (must be above zero)
<CoM1 x y z> = Center of mass of molecule 1 - three coords
<CoM2 x y z> = Center of mass of molecule 2 - three coords
<rotmat ...> = Rotation matrix to transform molecule 2 onto 1
               Use as:
               xtmp = coord[0] - CoM2[0];
               ytmp = coord[1] - CoM2[1];
               ztmp = coord[2] - CoM2[2];
               coord[0] = xtmp*R[0] + ytmp*R[1] + ztmp*R[2] + CoM1[0];
               coord[1] = xtmp*R[3] + ytmp*R[4] + ztmp*R[5] + CoM1[1];
               coord[2] = xtmp*R[6] + ytmp*R[7] + ztmp*R[8] + CoM1[2];
}
e.g.

1 2 0.9 0.9 9 30.1 25.7 81.9 30.5 26.6 23.8 0.281 -0.679 0.679 -0.648 -0.655 -0.387 0.708 -0.331 -0.624
POS  : <ID> <ID> <Positions ...>

Where:

ID           = The ID of molecule 1 (must be between 1 and Size)
ID           = The ID of molecule 2 (must be between 1 and Size)
Positions    = Zero-indexed residue pairs that are found in the MaxSub
               (When PDB files are read by the program they are renumbered
               for MaxSub processing from 0 onwards)

e.g.
POS  : 1 2   2:2 3:3 4:4 6:6 7:7 9:9
TRANS: <ID> <ID> <MaxSub> <Pairs>

Where:

ID           = The ID of molecule 1 (must be between 1 and Size)
ID           = The ID of molecule 2 (must be between 1 and Size)
MaxSub       = The MaxSub score between molecule 1 and 2 (must be 0 - 1)
MaxSub       = The MaxSub score between molecule 2 and 1 (must be 0 - 1)
Pairs        = The MaxSub pairs between molecule 1 and 2 (must be above zero)

e.g.

1 2 0.9 0.9 9
###################################
# Maxcluster Distance Matrix File
###################################
SIZE : 2
##########################
# Chain records
# PDB  : >ID< >Filename<
##########################
PDB  :      1   pdbs2/model.165.pdb
PDB  :      2   pdbs2/model.128.pdb
###################################
# Distance records
# DIST : >ID1< >ID2< >Distance<
###################################
DIST :      1      2     7.0162
##########################
# Maxcluster MaxSub File
##########################
# Size record
SIZE : 2
##########################
# Chain records
# PDB  : <ID> <Filename>
##########################
PDB  :      1   pdbs2/model.165.pdb
PDB  :      2   pdbs2/model.128.pdb
##########################
# Transformation records
# TRANS: <ID1> <ID2> <MaxSub 1-2> <MaxSub 2-1> <Pairs> <CoM 1> <CoM 2> <RotMat>
##########################
TRANS:      1      1       1.0000     1.0000   30     21.291   77.870    1.015     21.291   77.870    1.015      1.000    0.000 0.000    0.000    1.000    0.000    0.000    0.000    1.000
TRANS:      1      2       0.2953     0.2953   10     25.717   77.873   -1.284     65.534  -26.830   77.395     -0.507    0.782 0.362   -0.181    0.314   -0.932   -0.843   -0.538   -0.018
TRANS:      2      2       1.0000     1.0000   30     62.002  -29.267   75.081     62.002  -29.267   75.081      1.000    0.000 0.000    0.000    1.000    0.000    0.000    0.000    1.000
##########################
# Position records
# POS  : <ID> <ID> <Positions ...>
##########################
POS  :      1      2    14:14 15:15 16:16 17:17 18:18 19:19 20:20 21:21 22:22 23:23
##########################
# Maxcluster MaxSub File
##########################
# Size record
SIZE : 2
##########################
# Chain records
# PDB: >ID< >Filename<
##########################
PDB:      1   pdbs2/model.165.pdb
PDB:      2   pdbs2/model.128.pdb
##########################
# Maxsub records
# MS : >ID1< >ID2< >1-2< >2-1< >Pairs<
##########################
MS :      1          1  1.000   1.000     30
MS :      1          2  0.295   0.295     10
MS :      2          2  1.000   1.000     30
The performance of the MaxCluster program was compared to the maxsub and the tmscore programs. Run-time analysis of the programs indicates that by pre-loading the reference structure into memory, the MaxCluster program achieves a ten-fold speed increase during list processing. This makes it 4 and 9 times faster than maxsub and tmscore respectively.
Analysis of the output scores for each program indicate that the MaxCluster program produces alignments of comparable quality to the maxsub program in default mode and the tmscore program when run using the TM-score mode.
The pre-loading feature, combined with its comparitive structure alignment performance, make MaxCluster the program of choice for processing large protein datasets.
More details can be found in the Performance section.
MaxCluster is available as a pre-compiled binary from the download area.
If you have a question, see if it has been asked before in the Frequently Asked Questions.